Data Science (DSc) Research Group, Lab. Statistika,
Jurusan Matematika, FMIPA, Universitas Jember
Jember, 5 September 2024

|  Click For New News !!!
|
Dear all Visitors/ Users (Yang terhormat semua pengunjung/ pengguna)
This webpages (VSL, Virtual Statistics Laboratory) are mainly developed for the purposes of learning and practicing data analyses, especially using R.
The pages are supported by R, Shiny Server and MathJax, so that they mostly act as
Computing LaTeX Documents that can display maths/ stats equations, at the same time are able to do various statistical analyses
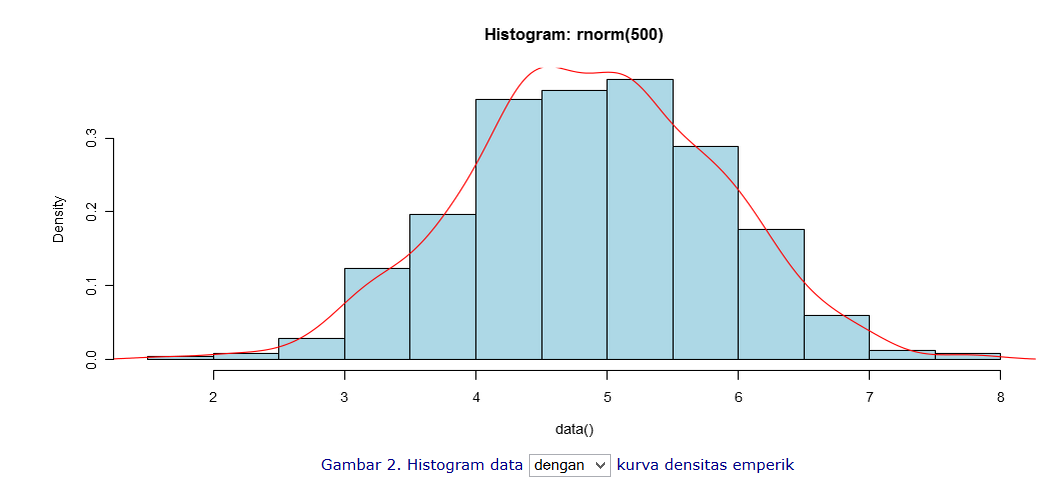
and computations as well as to display various statistical diagrams/plots using R.
[Halaman web ini terutama dikembangkan untuk tujuan belajar dan berlatih analisis data, khususnya menggunakan R.
Halaman-halaman tersebut didukung oleh R, Shiny Server dan MathJax, sehingga sebagian besar berfungsi sebagai
Dokumen LaTeX Penghitung yang dapat menampilkan persamaan matematika/statistik, sekaligus mampu melakukan berbagai analisis statistik
dan perhitungan serta menampilkan berbagai diagram/plot statistik menggunakan R.]
As per December 2018, up to now, VSL-NG have been utilizing Microsoft R Open with docker images running on docker containers [VSL-NG memanfaatkan Microsoft R Open 3.4 dalam bentuk docker images running dalam docker containers].
Most of the statistical presentations are already properly done, applying various R-packages. However, some of the
acommpanying documentations (notes/theories) are still under construction and will be upgraded continously. Users are advised to check appropriate references [
Semua visualisasi dan ilustrasi statistika telah dikerjakan dengan semestinya
dengan memanfaatkan berbagai paket R dan memberikan hasil yang semestinya, namun sebagian dokumenntasi teori yang menyertai (berkaitan)
masih dalam proses konstruksi. Untuk teori, pengguna diharapkan merujuk pada referensi yang sesuai.]
(..., 17 Oktober 2015. Agustus 2022, IMT)
Web ini resmi diluncurkan pertama kali, sebagai web VSL Laboratorium Statistika pada tanggal 2 September 2016, oleh
Dr. Sujito selaku Dekan FMIPA,
Universitas Jember.
Jika diperlukan bisa download Panduan Pemanfaatan Web VSL
Demi perbaikan Web ini
MOHON MEMBERI MASUKAN. Anda tidak perlu menyertakan identitas anda.
Bagi yang memerlukan skrip dari Web ini bisa diakses pada laman GITLAB SHINY
Diupdate 5 September 2024; 14:45 (WIB)
IMT
LIST OF CONTENTS
SIDEBAR
All Main Contents can also be accessed through this Sidebar Menushttps://dsc.mipa.unej.ac.id/
Sidebar Menu
Visitors
Since 20 December 2016
Thank you for visiting Us
Supporters
-
 The University of Jember provides space and R-shiny server
-
 Maintaining and Contributing Contents
-
 Develops various Shiny Toolkits and Shiny Server
-
 All statistical calculation and graphical representation are done using
R (with various packages) on LiNuX flatform (Click to see the list) .
All statistical calculation and graphical representation are done using
R (with various packages) on LiNuX flatform (Click to see the list) .
-
 All mathematical equations are done using latex format (especially AMS LaTeX) powered by MathJax
- DreamTemplate
This web format is extension and modification from DreamTemplete
We thank supporters who directly or indirectly make this web possible
Popularitas R
Popularitas R
Popularitas R dibanding beberapa software statistika lainnya.
Revolutions
Berita harian tentang R
R Bookdown
Koleksi buku-buku berbasis web penerapan R berbagai bidang
R Online References
Referensi online terkait R